Overview

The San Diego River Watershed encompasses a land area of 434 square miles, making it the second largest watershed management area (WMA) located in San Diego County. It lies in the central portion of the County and neighbors Los Penasquitos and San Dieguito River Watersheds to the north and San Diego Bay WMA to the south.
The watershed can be divided into four distinct hydrological areas, each with unique geological and environmental features:
- Lower San Diego (907.1)
- San Vicente (907.2)
- El Capitan (907.3)
- Boulder Creek (907.4)
Rainfall to the area primarily drains through the San Diego River, which stretches east to west over a distance of roughly fifty-two (52) miles and originates near Santa Ysabel, in the Cuyamaca Mountains. The river eventually discharges to the Pacific Ocean near the community of Ocean Beach.
Currently, about forty-four percent (44%) of the watershed management area (WMA) remains undeveloped. The remaining fifty-six percent (56%) of the land area is being utilized for open space and park land (23%), residential areas (19%), transportation (6%), and other (2%). The remaining ‘other’ two percent (2%) includes commercial, agricultural, industrial, military, and miscellaneous land uses. To see a more detailed breakdown of land uses by hydrologic area, please see Lower San Diego, San Vicente, El Capitan, and Boulder Creek Hydrologic Area descriptions below.
The most populous WMA in San Diego County, the San Diego River Watershed is estimated to be home to approximately 520,000 residents, according to 2010 US Census data. The vast majority of the population is concentrated in the more developed urban and suburban regions of the lower watershed, which bears a disproportionate share of the pollution burden when compared to portions of the watershed upstream. Given its dense population, the watershed suffers from several human-induced pollutants, which have the potential to negatively impact how residents, business-owners, and tourists use and interact with local water bodies.
San Diego River Watershed supplies roughly 760,000 individuals with potable water sourced from one of five reservoirs: Lake Murray, Lake Jennings, San Vicente, El Capitan and Cuyamaca Reservoirs. The majority of these reservoirs can be found in the eastern half of the watershed, upstream from the Lower San Diego Hydrologic Area.
It is important to note, however, that the watershed serves more than just humans. The San Diego River Watershed consists of a variety of unique and diverse ecosystems that act as critical habitat for a number of endangered species, including the arroyo toad, least bell’s vireo, and the southwestern pond turtle.
For more information about water bodies see the San Diego Basin Plan, which provides information on uses of water bodies and water quality objectives, beneficial uses and the 303(d) list, which identifies water body segments not meeting water quality standards.
Water Quality Improvement Plan (WQIP)
Agencies involved in the development of the San Diego River Water Quality Improvement Plan (WQIP) include the Cities of El Cajon, La Mesa, Santee, San Diego, the County of San Diego, and the California Department of Transportation. The WQIP is a requirement of updated stormwater regulations adopted by the Regional Water Quality Control Board (Regional Board) according to Order No. R9-2013-0001, as amended by Order Nos. R9 2015-0001 and R9-2015-0100. The ultimate goal of the WQIP is to protect, preserve, enhance, and restore water quality of receiving water bodies. These improvements in water quality will be accomplished through an adaptive planning and management process that identifies the highest priority water quality conditions within the watershed and implements strategies to address them.
The San Diego River Water Quality Improvement Plan was originally submitted to the Regional Board on June 26, 2015, as required by the Municipal Permit. The WQIP was subsequently revised and resubmitted in order to incorporate comments received from the public and the Regional Board. Following further comments, the Regional Board issued an acceptance letter for the San Diego River WQIP on February 12, 2016. The resulting WQIP, appendices, and acceptance letter are available at the links above.
2021 Water Quality Improvement Plan Update
The San Diego River Watershed Management Area jurisdictions developed an update of the Water Quality Improvement Plan (WQIP). The focus of the update was the incorporation of Famosa Slough Alternative Total Maximum Daily Load (TMDL). The update was submitted to the San Diego Regional Water Quality Control with the Water Quality Improvement Plan 2019-2020 Annual Report provided in Appendix 5, Attachment 5B. The Regional Board issued an acceptance letter for the WQIP update on August 9, 2021.
WQIP Annual Reports
The San Diego River Watershed Management Area (WMA) Water Quality Improvement Plan (WQIP) Annual Reports allow copermittees to demonstrate progress made during the fiscal year towards achieving water quality goals. They are a direct requirement of the National Pollutant Discharge Elimination System (NPDES) Permit, Order No. R9-2013-0001, as amended by Order Nos. R9-2015-0001 and R9-2015-0100. The Annual Reports contain specific information regarding strategy implementation and monitoring efforts and data. Furthermore, they serve as a basis upon which copermittees may choose to adaptively manage their highest priorities and goals/strategies, according to the most recent water quality data.
For most San Diego Region watersheds, FY 2015-16 is the first year of WQIP implementation and is therefore the first year of annual reporting. Annual reports are submitted to the Regional Board by January 31 of the following year
Below are the most recent annual reports, to view years prior to 2015-2016 click here.
Jurisdictional Runoff Management Plans
The Regional Stormwater Permit (Order No. R9-2013-0001, as amended by Order Nos. R9-2015-0001 and R9-2015-0100) requires that the San Diego Region Copermittees provide access to their Jurisdictional Runoff Management Program documents on a Regional Clearinghouse website. The purpose of JRMP documents are to guide implementation of programs and strategies to reduce pollutants discharged from each Copermittee’s storm drain system to receiving waters. The JRMPs for each Copermittee involved in the San Diego River WMA are linked to below.
City of El Cajon JRMP and GIS data files
City of La Mesa JRMP and GIS data files
City of San Diego JRMP
City of Santee JRMP and GIS data files
County of San Diego JRMP and GIS data files
BMP Design Manuals
The Regional Stormwater Permit (Order No. R9-2013-0001, as amended by Order Nos. R9-2015-0001 and R9-2015-0100) requires that the San Diego Region Copermittees provide access to their BMP Design Manuals and associated documents on a Regional Clearinghouse website.
The BMP Design Manuals for each Copermittee involved in the San Diego River WMA are linked to below:
City of El Cajon
City of San Diego
City of Santee
City of La Mesa
County of San Diego
Model BMP Design Manual
The San Diego County Copermittees developed a Model BMP Design Manual for the San Diego Region in order to conform to updated development requirements of the 2013 Municipal Storm Water Permit (Order No. R9-2013-0001, as amended by Order Nos. R9-2015-0001 and R0-2015-0100). The Model BMP Design Manual provides procedures for planning, selecting and designing onsite structural BMPs for new development and significant redevelopment projects in accordance with the 2013 Municipal Permit. Additionally, the Regional Manual provides a basis for the development of local BMP Design Manuals by each Stormwater Copermittee in the San Diego region.
Each Copermittee was required to update its local BMP Design Manual in accordance with the content of the regional model on or before the February 16, 2016 deadline outlined in the 2013 Permit.
The final model BMP Design Manual, its appendices, and associated materials can be retrieved here:
Other Plans and Projects
Additional plans and projects not necessarily associated with the Water Quality Improvement Plan (WQIP) are listed below.
San Diego River Investigative Order
The San Diego Regional Water Quality Control Board adopted Investigative Order No. R9-2019-0014 in June 2019, requiring regulated parties to submit technical and monitoring reports to quantify the sources and transport pathways of human fecal material to the lower San Diego River watershed. The regulated parties include all the NPDES permittees in the lower San Diego River watershed with the potential to contribute human fecal material. The Investigative Order also stipulates which human fecal sources and pathways to investigate and the timeline on which to report the results of the study. The SDR Investigative Order page which includes information about Steering and Technical Committee meetings, Work Plans, and Semi Annual Reports is linked below.
Transitional Monitoring and Assessment Program Report (TMAR)
A requirement of the Municipal Permit Order No. 2013-0001 (as amended in Order Nos. R9-2015-0001 and R9-2015-0100), transitional monitoring was conducted and reported on prior to development of the San Diego River WQIP. The reports, appendices, and associated documents can be found below:
Things To Consider
When excessive quantities of pollutants are deposited into these water bodies, they may inhibit many or all of these beneficial uses and can result in actions such as beach closures and postings, etc. Sources of pollutants within the San Diego River Watershed include urban and agricultural runoff, mining operations, and sewage spills.
Under Section 303(d) of the Clean Water Act, the Lower San Diego River Watershed was identified as impaired for coliform bacteria. This condition is required to be addressed through a number of best management practices and regular monitoring. As such, copermittees (also referred to as Responsible Agencies (RAs)) to the National Pollutant Discharge Elimination System (NPDES) Permit focus their treatment and cleanup efforts on this particular water quality condition.
As part of the process, however, copermittees are required to develop a comprehensive Water Quality Improvement Plan (WQIP) for the WMA that identifies highest priority water quality conditions, strategies to address them, and monitoring plans. The WQIP and associated Annual Reports are required by Order No. R9-2013-0001 as amended by Order Nos. R9-2015-0001 and R9-2015-0100 and pertain specifically to improving the quality of both storm water and non-storm water discharged by copermittees’ municipal separate storm sewer systems.
In the San Diego River WMA, copermittees include the County of San Diego and the Cities of San Diego, El Cajon, La Mesa, Poway, and Santee. The WQIP for the San Diego River WMA was submitted and received approval from the Regional Water Quality Control Board in February 2016. Copermittees within the San Diego River WMA selected bacteria in the Lower San Diego River Watershed as their highest priority water quality condition.
Hydrologic Area (HA) Descriptions
Lower San Diego HA (907.1)
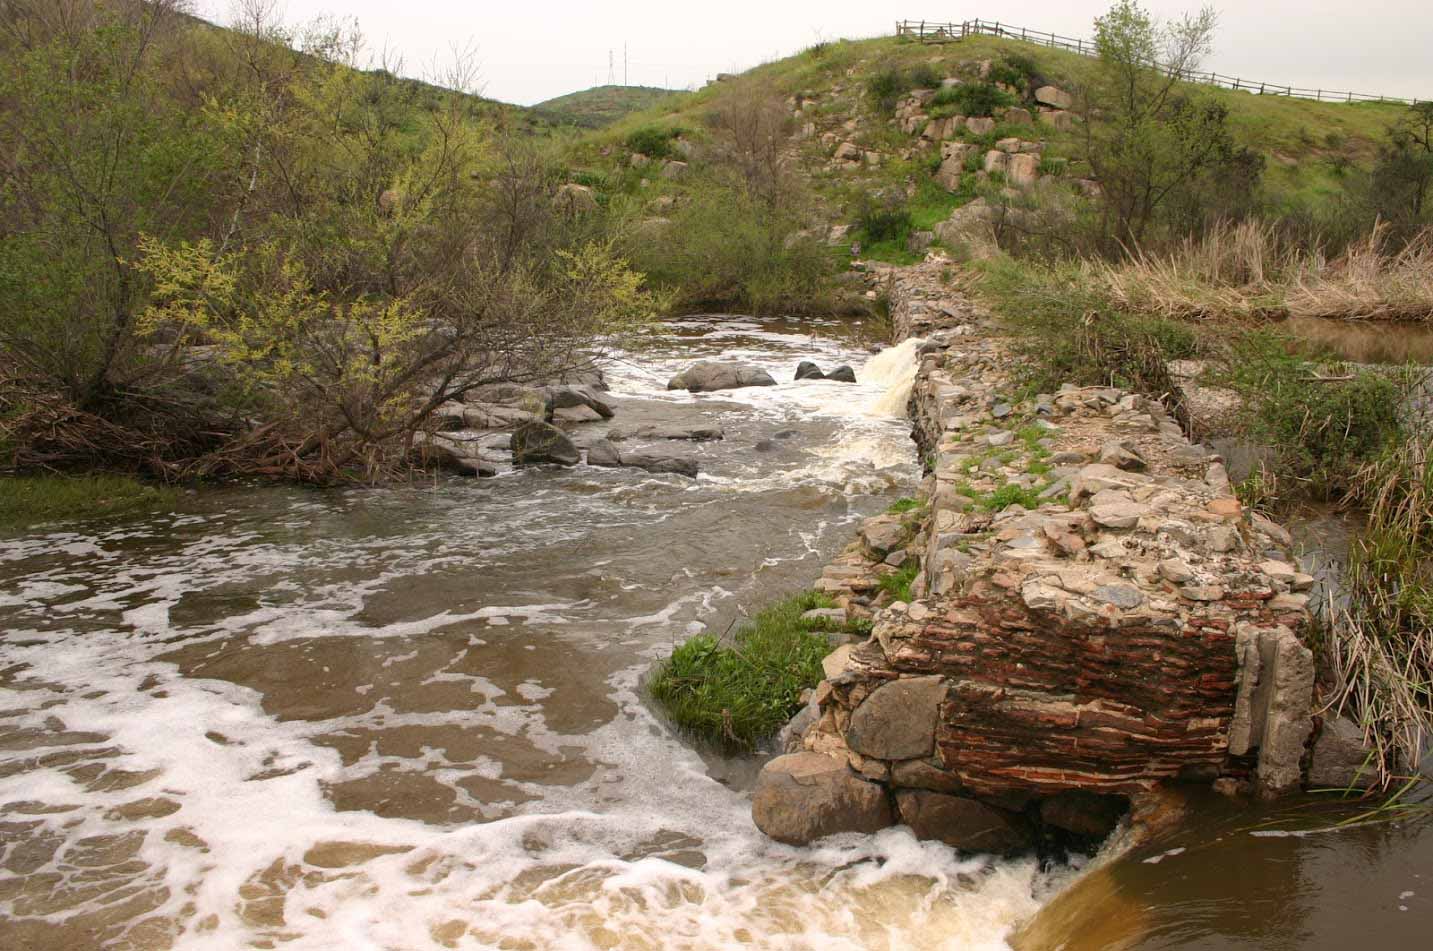
Old Mission Dam – https://photos.google.com/share/AF1QipMhVPpDTPfkTy7TU2k4Rz-8ZuwGpQifL9igkvzTC-YqN5kcFumon7inrf1t6DwNLA/photo/AF1QipOGjVnhzL-zGyusDxExu__ABn1yV93iNnkLyK_D?key=bnIyZ051T1hRa0ItV0xiR1JyX2dmMXJldVhWeHRn (Credit, San Diego Park Foundation)
Of the HAs located within the San Diego River Watershed, the Lower San Diego Hydrologic Area (907.1) is the most urbanized and suffers from the most pronounced water quality problems. At roughly 110,000 acres, it is also the largest and represents approximately forty percent (40%) of the watershed. Due to its geographic extent, oversight of the storm drain systems within the Lower San Diego Hydrologic Area falls on a number of copermittees: namely, the County of San Diego in combination with the Cities of Santee, El Cajon, La Mesa, and San Diego.
Typically, surface runoff within the basin drains into the San Diego River and is subsequently discharged directly into the Pacific Ocean at Ocean Beach. At the point where the San Diego River meets the Pacific Ocean lies a 37 acre wetland, Famosa Slough, which is managed by the City of San Diego. In addition, the Lower San Diego Hydrologic Area is home to Lake Murray, one of a few major reservoirs within the San Diego River WMA.
The Lower San Diego Hydrologic Area is significantly more developed than its counterparts upstream. Here, undeveloped and open lands make up roughly forty-three percent (43%) of the land area, followed closely by residential uses at thirty percent (30%).
Due to extensive anthropogenic modifications to the environment associated with urbanization, several native plant and animal species commonly found in the Lower San Diego Hydrologic Area have been put at risk of endangerment. A number of threatened and endangered species have been observed here, including the coastal California condor, the great grey owl, the horned lizard, and the kangaroo rat.
The Lower San Diego system consists of a number of water bodies that are listed as impaired under Section 303(d) of the Clean Water Act. Several of the water bodies listed as impaired include Alvarado Creek, Lower San Diego River, Forester Creek, and Lake Murray. These water bodies are impacted by pollutants such as fecal coliform, enterococcus, selenium, nitrogen, manganese, phosphorus, total dissolved solids, and low dissolved oxygen.
San Vicente HA (907.2)
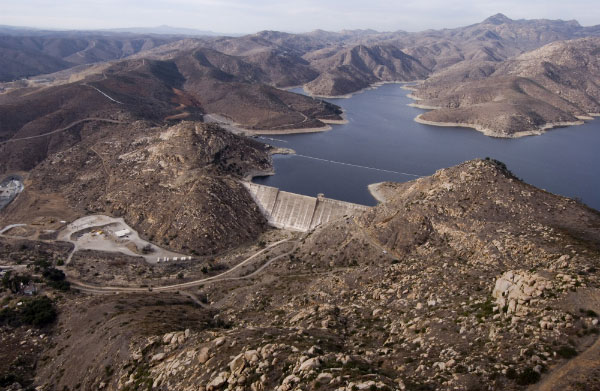
San Vicente Reservoir – http://www.waterpowermagazine.com/uploads/newsarticle/1057597/images/210223/large/l%202007.jpg
At roughly 47,000 acres, the San Vicente Hydrologic Area is the smallest drainage basin within the San Diego River WMA and has a considerable share of undeveloped land. With the exception of some Native American tribal lands, the entirety of the San Vicente Hydrologic Area lies within the jurisdiction of the County of San Diego.
All of the surface water here flows into and is impounded within San Vicente Reservoir. However, underground aquifers also contribute significantly to the local water supply. Water agency supply records and population data indicate that hundreds of private groundwater wells exist in the San Vicente Hydrologic Area alone.
In recent years, the San Vicente sub-watershed has seen continued human expansion that exerts increasing pressure on the surrounding habitat and ecosystems. Some examples of threatened and endangered species that are known to occur in the San Vicente Hydrologic Area are the Encinitas baccharis, the arroyo toad, and the bald eagle.
Land uses in this portion of the WMA tend to be more variable that in other areas. One of the most recent figures estimates that the San Vicente HA is made up primarily of lands that are undeveloped or open spaces, at sixty-five percent (65%) of the total area. Residential land uses follow, constituting approximately sixteen percent (16%) of the HA. A portion of the sub-watershed is also allocated Native American Reservation land and lies outside of the jurisdiction of typical copermittees.
The San Vicente sub-watershed is home to a couple of water bodies that are listed as impaired under Section 303(d) of the Clean Water Act. For example, San Vicente Creek and San Vicente Reservoir have been listed as impacted by a number of pollutants, including nitrogen, chloride, sulfates, and elevated aquatic toxicity and pH levels.
El Capitan HA (907.3)
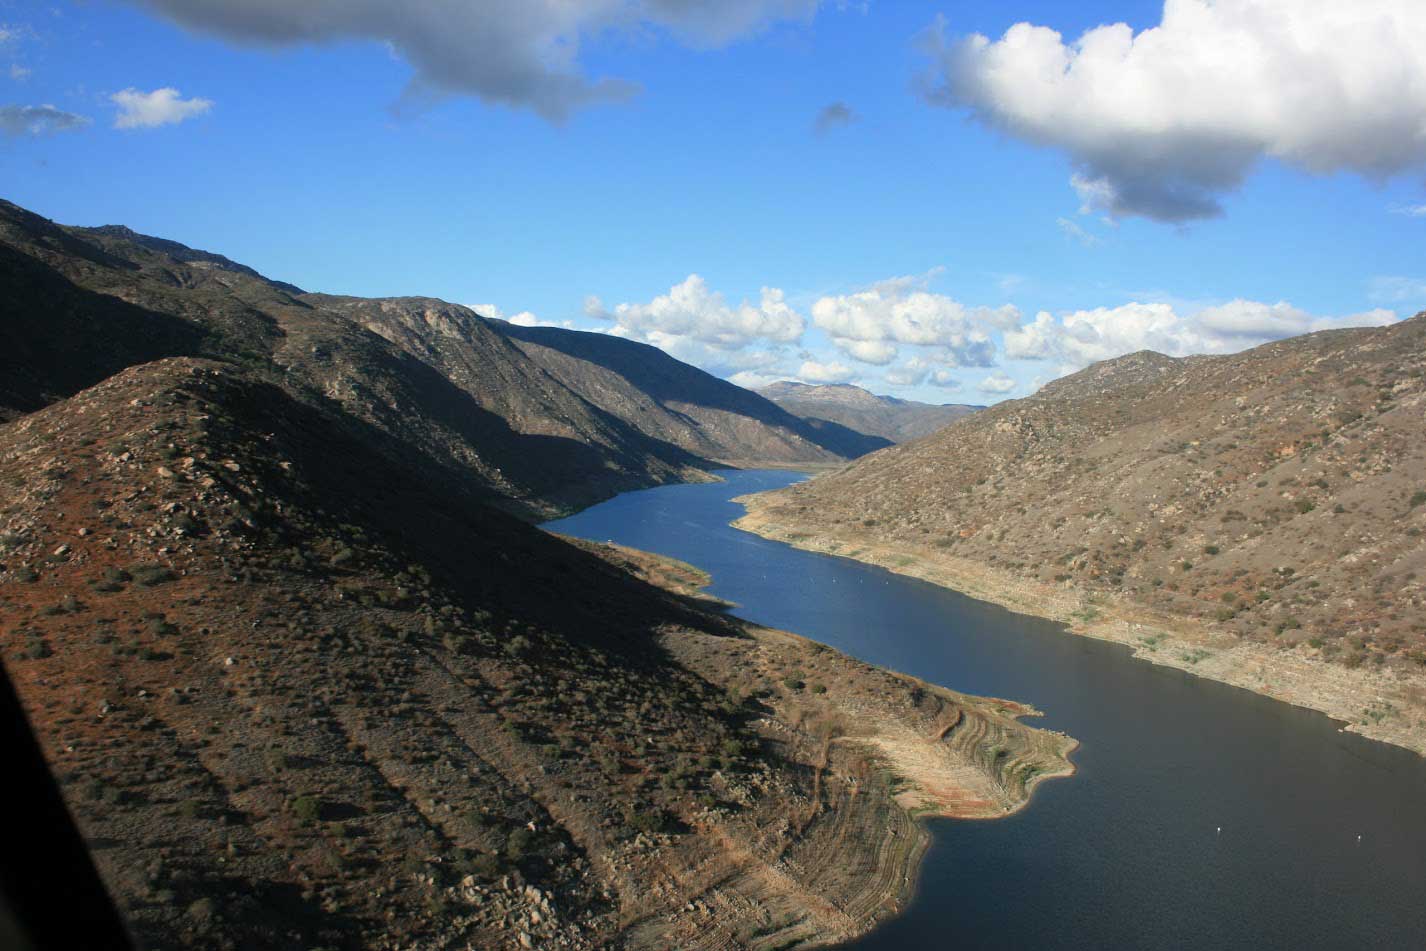
El Capitan Reservoir – https://photos.google.com/share/AF1QipMhVPpDTPfkTy7TU2k4Rz-8ZuwGpQifL9igkvzTC-YqN5kcFumon7inrf1t6DwNLA/photo/AF1QipN_oCnf-f5mRXSnCoYQQwCi7dkWmX_JDDVxdr6z?key=bnIyZ051T1hRa0ItV0xiR1JyX2dmMXJldVhWeHRn (Credit, San Diego River Park Foundation)
El Capitan Hydrologic Area is located just south of the Boulder Creek and San Vicente Hydrologic Areas and covers a land area of about 56,000 acres. It lies primarily within the jurisdiction of the County of San Diego; however, the portion of the sub-watershed within the Capitan Grande Reservation is outside of the jurisdiction of the County of San Diego.
The hydrologic area receives significant runoff from the community of Alpine through Chocolate and Peutz Valley Creeks. All surface runoff, however, is eventually directed into El Capitan Reservoir, a water body that was created by damming San Vicente Creek in 1935. Prior to completion of the San Vicente Dam Raise Project in 2015, El Capitan Reservoir had the greatest storage capacity of any reservoir in the City of San Diego reservoir system. In order to satisfy demand, reservoir supplies are supplemented by groundwater sourced from local aquifers.
Like its neighbor hydrologic areas, the El Capitan system contains vast tracts of undeveloped land, including portions of the Cleveland National Forest. In fact, about eighty-seven percent (87%) of its land area is currently undeveloped land or open space, and only nine percent (9%) of the hydrologic area is being utilized for residential land uses. The remaining land area is divided between other miscellaneous uses.
Unfortunately, El Capitan Lake has been identified under Section 303(d) of the Clean Water Act as impaired for pollutants including manganese, phosphorus, nitrogen, and pH. Urban runoff is considered the most substantial contributor of many of these constituents.
Boulder Creek HA (907.4)
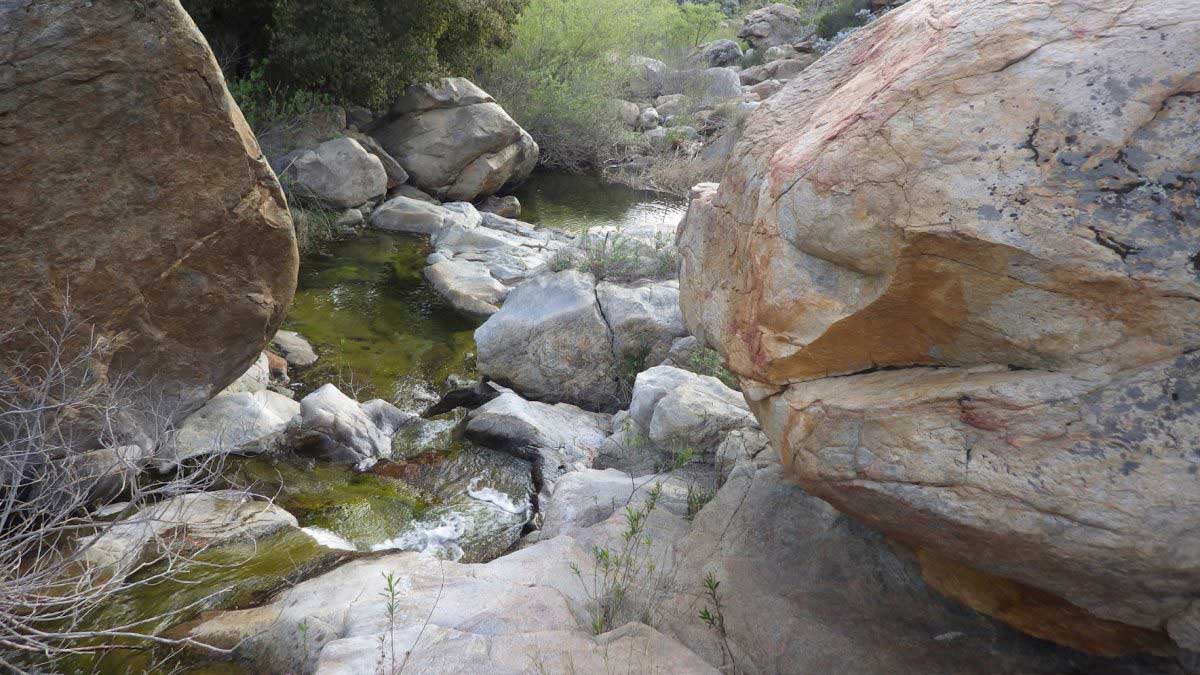
Cedar Creek – https://photos.google.com/share/AF1QipMhVPpDTPfkTy7TU2k4Rz-8ZuwGpQifL9igkvzTC-YqN5kcFumon7inrf1t6DwNLA/photo/AF1QipOe-8Yomho72wMqwHwKiItH6Go_A0OcrlMGpwpV?key=bnIyZ051T1hRa0ItV0xiR1JyX2dmMXJldVhWeHRn (Credit, San Diego River Park Foundation)
Known as the headwaters, the Boulder Creek Hydrologic Area begins with William Heise County Park and Cuyamaca Rancho State Park in the east and extends westward to encompass a region of approximately 63,000 acres. Although the County of San Diego has been identified as the only copermittee within the hydrologic area, the Inaja and Cosmit Indian Reservation constitutes a large part of the basin. As federal lands, however, the Reservation is not subject to the same requirements as those lands under County jurisdiction.
Primary water bodies in the system include Boulder Creek and Cuyamaca Reservoir, a lake located near the eastern border of the WMA. Almost all water in the Boulder Creek Hydrologic Area originates from the melting of seasonal snow cover. As such, the flow rate of creeks and rivers in the system and downstream varies immensely depending upon the season. Low-flow conditions in the system typically occur from October to March. High-flow conditions, on the other hand, generally occur between May and July, peaking in June. These waters typically have very low concentrations of dissolved solids, alkalinity, and nutrients compared to downstream waters. Surface waters frequently have near-neutral pH values, and dissolved oxygen is at or near saturation.
Encompassing large tracts of the Cleveland National Forest, land use is in the hydrologic area is dominated principally by undeveloped lands and open space, making up about eighty-eight percent (88%) of the sub-watershed area. The remainder of the land is distributed between residential uses (7%), agricultural uses (3%), and other uses.
Experiencing minimal effects on water quality due to development, water bodies within this region of the management area have largely escaped water quality issues that are more prevalent in portions of the watershed downstream.